Why a Detector's Confidence Is Not a Probability
A detector reports a person with confidence 0.87, and it is tempting to read that as "87% chance this is a person". Operators read it that way, clients read it that way, and engineers often half-believe it. It is not true in general, and treating it as true leads to thresholds that break silently when the model changes.
This article explains what a detector's confidence score is, why it is usually not a calibrated probability, and how to work with it correctly.
What the score is
In a typical modern YOLO detector, the network outputs, for each candidate box, a score per class after a sigmoid function, so each value lies between 0 and 1. The highest class score becomes the box's confidence. Training pushes scores towards 1 for boxes that match real objects and towards 0 for everything else, using a loss function and target assignment rules that vary between model versions.
Nothing in that process forces the scores to be calibrated, meaning that among all boxes scored 0.8, about 80% are correct. The score is a ranking signal: higher usually means more likely to be right. How much more likely is not fixed.
What calibration would look like
A reliability diagram makes this visible. Group boxes by score into bins, and for each bin, compute the share of boxes that match a real object. A perfectly calibrated detector lies on the diagonal.
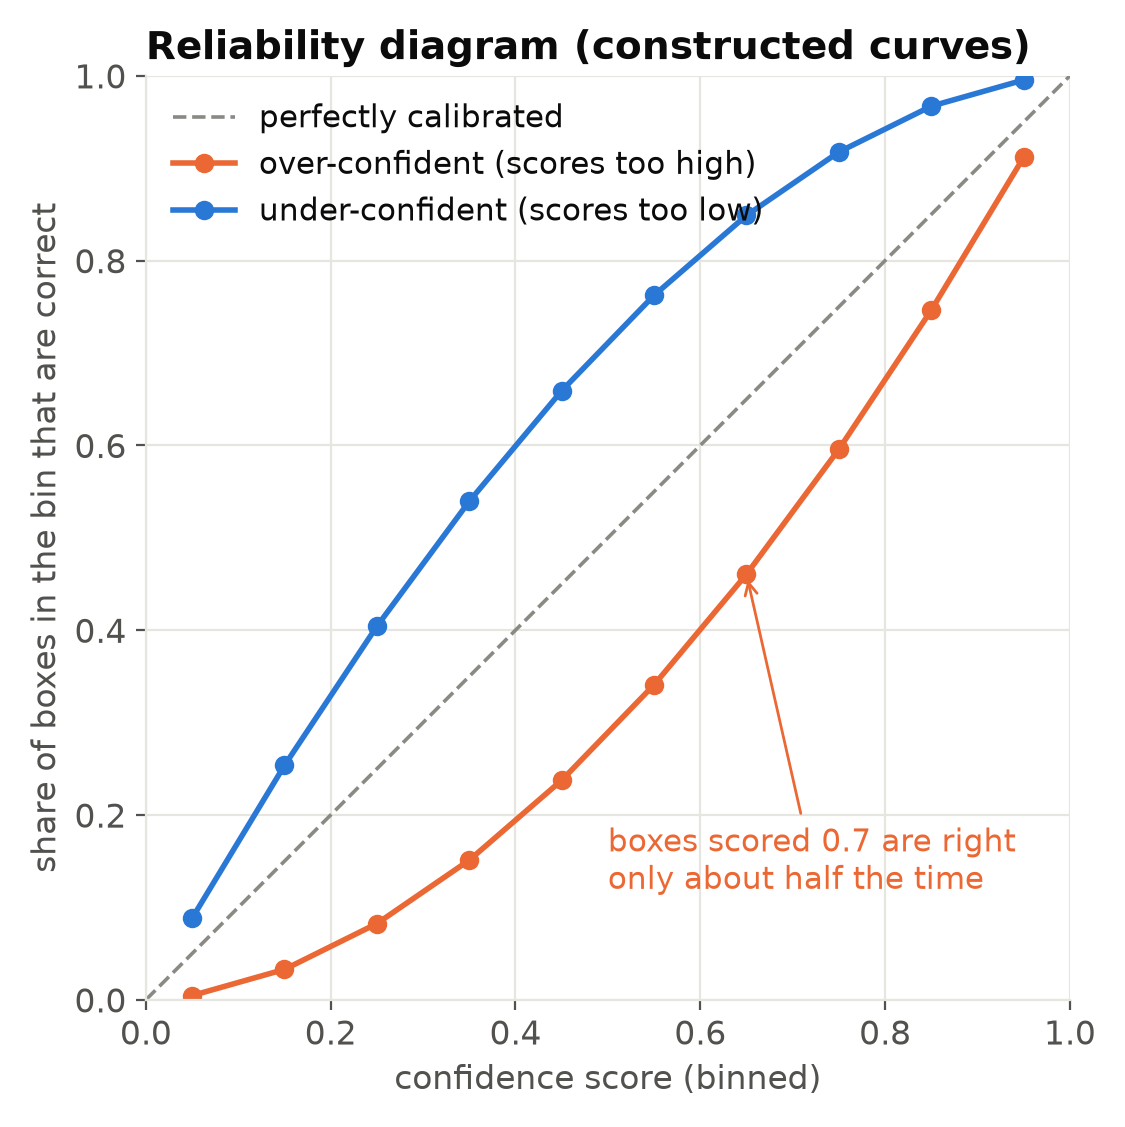
You can draw this for your own model on your validation set: match predictions to ground truth by IoU as the evaluator does, bin by score, and plot. The shape is often surprising, and it differs by class.
Why scores shift
Even if one model happened to be well calibrated, its scores are not stable across changes. Scores move when you change:
- The model or its size. A small model and a large one trained on the same data give different score distributions.
- The training run. Different seeds, epochs or augmentations produce different scores for the same image.
- The training data. Adding hard negatives often lowers scores on lookalike objects and sometimes on real ones nearby. See Hard Negative Mining from Production Footage.
- Precision. FP16 and especially INT8 conversion shift scores. See INT8 Quantization for Detectors.
- Input size and pre-processing. A different resize or input size changes what the network sees. See Preprocessing Mismatches That Silently Cost Accuracy.
- The scene. Night footage, a new camera angle or heavy compression typically lowers scores for real objects.
And scores differ between classes within one model. A rare class may rarely exceed 0.6 even when correct, while a common class routinely scores above 0.9.
Consequences for thresholds
A threshold belongs to one model
A threshold of 0.5 tuned for model version 1.7 means something different for 1.8. After every retraining or export, re-tune thresholds on validation data. Ship thresholds with the model as one package, not as a separate setting. See Updating Models on Edge Devices Without Bricking Them.
Tune per class
Because classes have different score distributions, one global threshold is a compromise. Choose each class's threshold from its own precision-recall curve at the precision or recall you need. See Confidence Thresholds: Tuning a Detector to Cut False Alarms.
Re-check per condition
If night scores are systematically lower, a threshold that works by day misses people at night. Check precision and recall per condition at your chosen thresholds; per-mode thresholds can be justified. See Day/Night Switching.
Do not show raw scores as probabilities
Displaying "87% confidence" next to an alert invites operators to treat it as a probability. They will learn that "87%" alerts are sometimes wrong and lose trust, or they will ignore "55%" alerts that are actually reliable for that class.
Better options:
- Show no score at all; the alert passed the threshold, which is the decision.
- Show a simple category, such as "high" and "normal", with boundaries chosen from validation data.
- If you must show a number, calibrate it first, and say what it means.
Calibrating scores when you need probabilities
Sometimes you do need meaningful probabilities, for example to combine evidence across several frames or cameras, or to set an alert policy in terms of expected false alerts. Standard calibration methods, developed mainly for classifiers, can be applied to detector scores after matching boxes to ground truth:
- Temperature or Platt scaling: fit a simple function (one or two parameters) that maps raw scores to calibrated ones on validation data.
- Isotonic regression: fit a flexible monotonic mapping; needs more data.
Fit per class if classes behave differently, check the result with a reliability diagram on held-out data, and refit after every model change. Calibration does not change the ranking of boxes, so precision-recall curves and AP stay the same; only the meaning of the numbers changes.
Scores in tracking and temporal filters
Pipelines often average a track's confidence over its life, or require a minimum score over several frames. That is fine as long as you remember it is a heuristic. An average of uncalibrated scores is not a probability either. Tune these rules with event-level evaluation on real footage, not by reasoning about what the numbers ought to mean. See Measuring Video Analytics by Events, Not Frames.
Checklist
- Treat confidence as a ranking, not a probability.
- Draw a reliability diagram per class on validation data if scores matter.
- Re-tune thresholds after any model, data, precision or input change.
- Tune thresholds per class and check them per condition.
- Ship thresholds with the model version.
- Do not show raw scores to operators as percentages.
- Calibrate per class, on held-out data, if you need real probabilities.
Next steps: Confidence Thresholds: Tuning a Detector to Cut False Alarms and What mAP Hides.