mAP, Precision and Recall: How to Read Detection Results
After training a detector you get a table of numbers: precision, recall, mAP50, mAP50-95. They look similar and people often quote the biggest one. That is a mistake. Each number answers a different question, and the right one for you depends on what a wrong detection costs.
This article explains each metric in plain terms, shows how to get them from Ultralytics, and gives a way to choose.
Start with the three outcomes
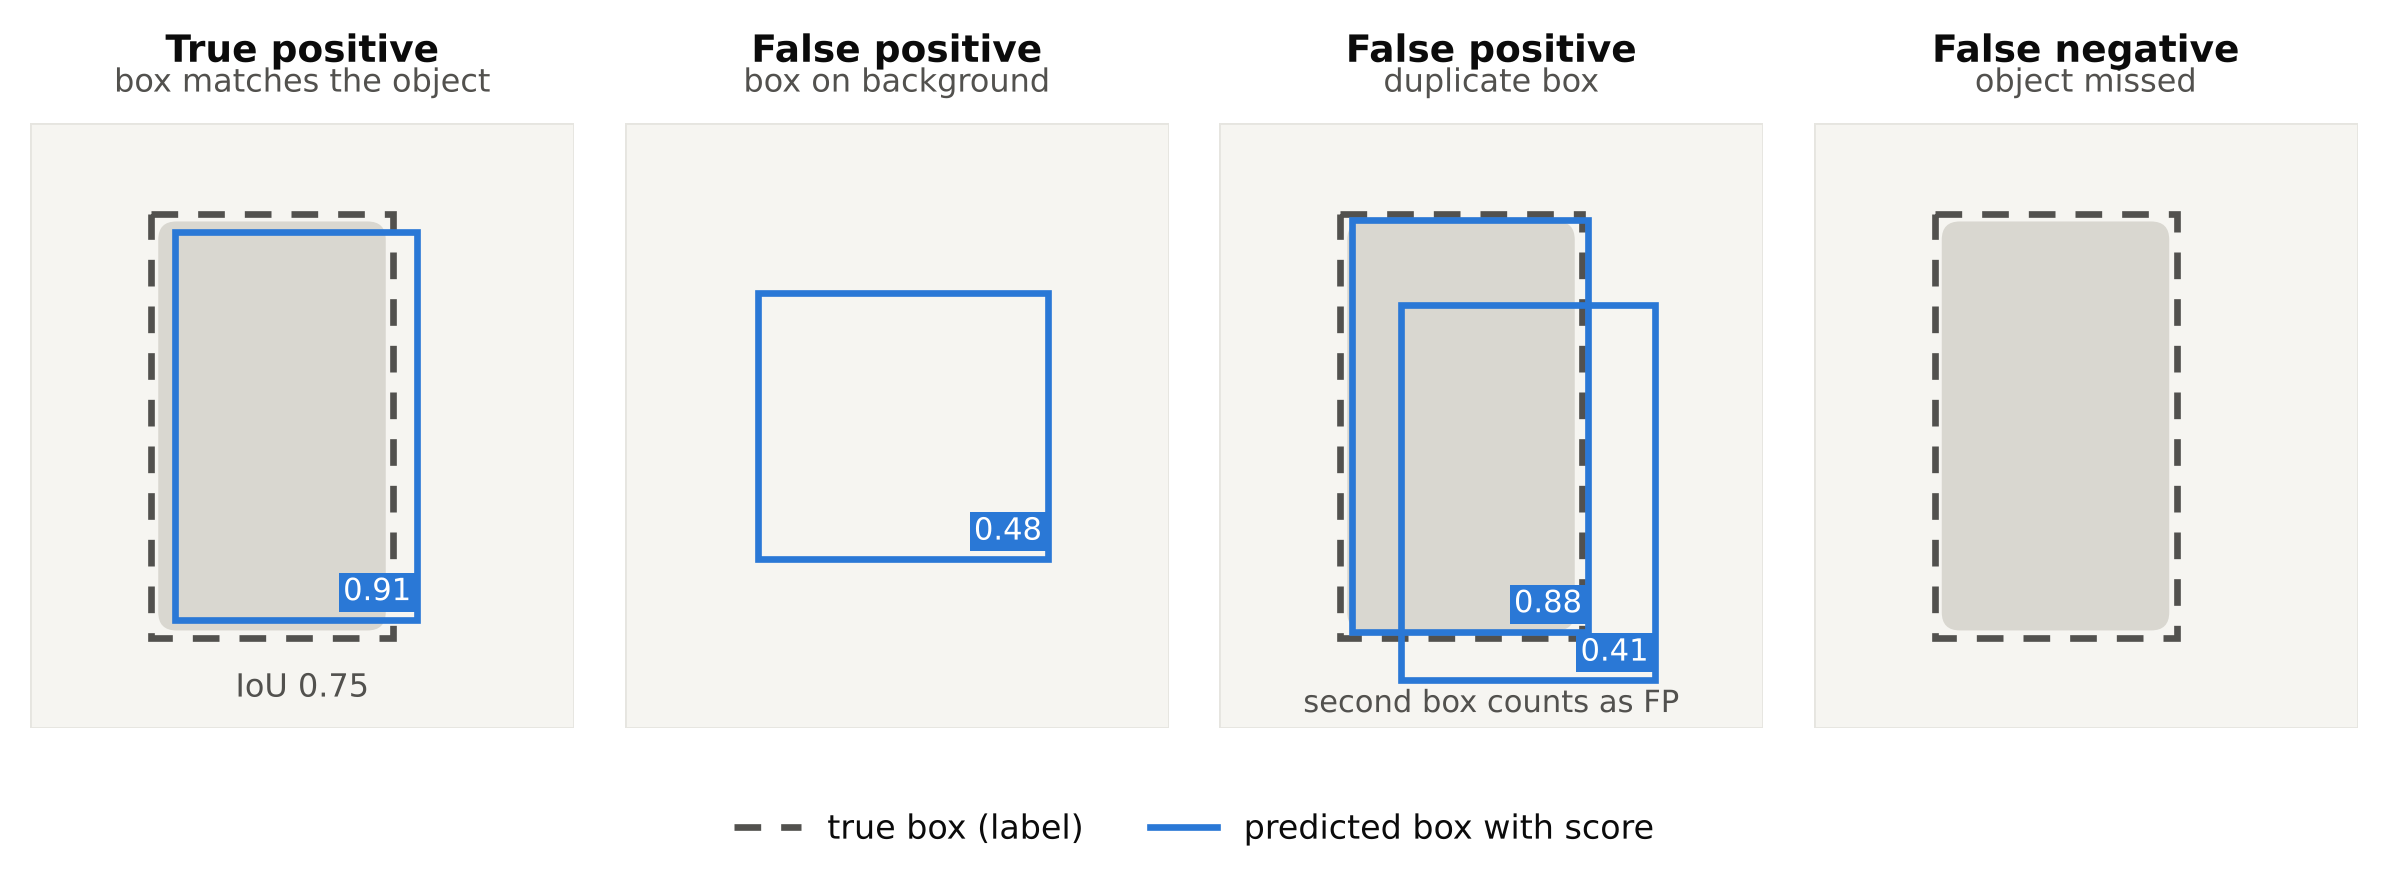
For every prediction, a detector is either right or wrong, and for every real object it either finds it or does not. That gives three counts:
- True positive (TP): a predicted box that matches a real object.
- False positive (FP): a predicted box with no real object, or a duplicate, or the wrong class.
- False negative (FN): a real object the model missed.
"Matches" needs a rule. The usual rule is that the predicted box overlaps the true box enough, measured by Intersection over Union (IoU), and the class is correct. If IoU is new to you, read IoU and Non-Maximum Suppression first.
Precision
Precision = TP / (TP + FP).
It answers: of everything the model reported, how much was correct? High precision means few false alarms. If precision is 0.5, half of your alerts are wrong.
Recall
Recall = TP / (TP + FN).
It answers: of everything that was really there, how much did the model find? High recall means few misses. If recall is 0.5, the model misses half the real objects.
They pull against each other
You can raise one by sacrificing the other, and the confidence threshold is the lever. Lower the threshold and the model reports more boxes. Recall goes up because fewer objects are missed, and precision goes down because more junk gets through. Raise the threshold and the opposite happens.
So a single precision number is meaningless unless you know the threshold it was measured at. The same is true for recall. This is why a summary that does not depend on one threshold is useful.
Average precision and mAP
If you sweep the threshold from high to low and plot precision against recall, you get a precision-recall curve for one class. The area under that curve is the average precision (AP) for that class. A model that keeps high precision even as recall rises has a large area. A model whose precision collapses quickly has a small one.
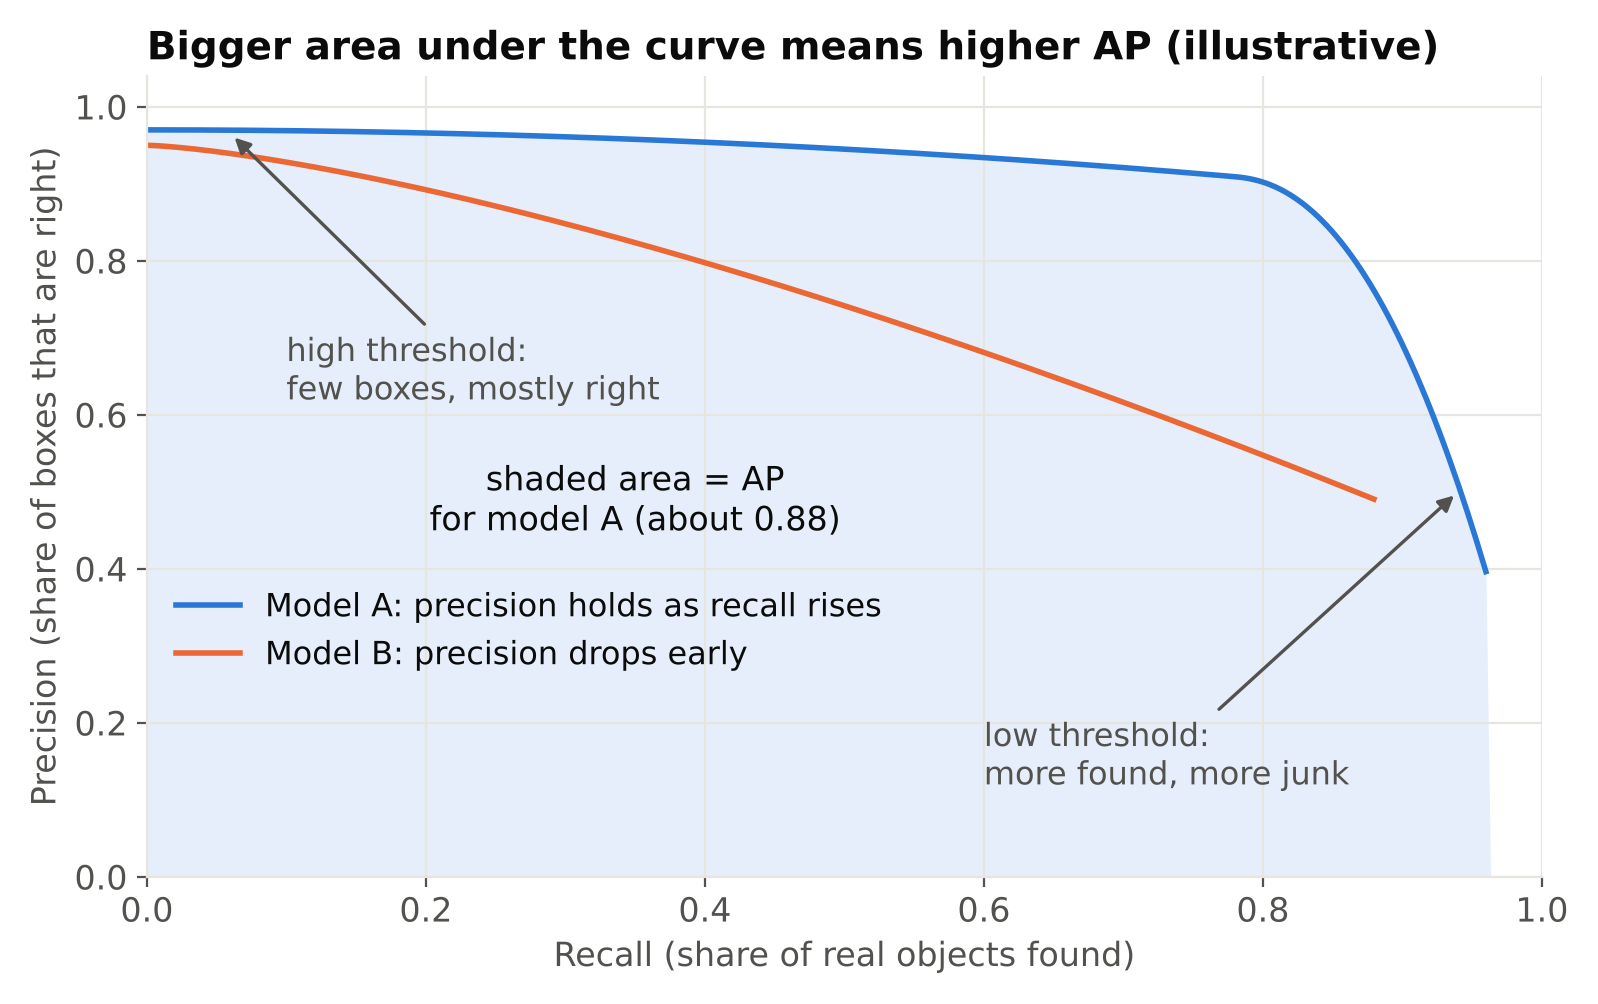
mAP is the mean of AP over all classes. If you have three classes, mAP is the average of the three AP values. Two things follow:
- A rare class counts as much as a common one. One weak class pulls mAP down even if the others are excellent.
- mAP says nothing about which class is weak. Always look at per-class values too.
mAP50 versus mAP50-95
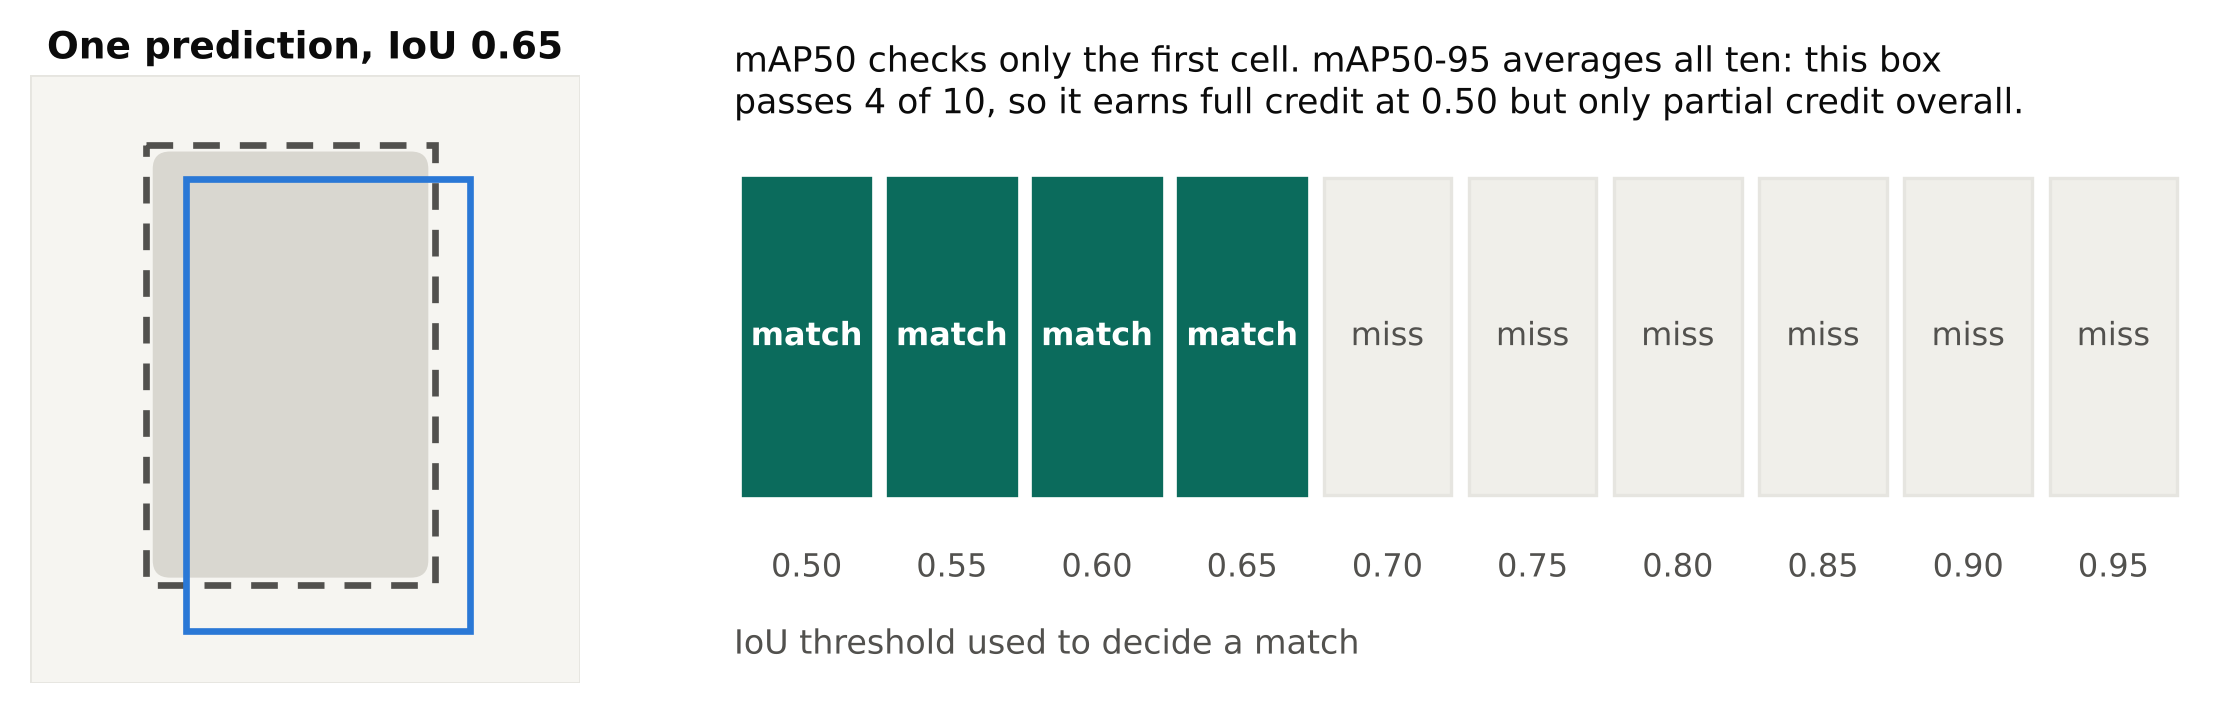
The "50" and "50-95" refer to the IoU threshold used to decide whether a box counts as a match.
- mAP50: a prediction counts if IoU with the true box is at least 0.5. This is forgiving. A box that covers about half of the object can still count.
- mAP50-95: the average of mAP computed at IoU thresholds from 0.5 to 0.95 in steps of 0.05. This rewards tight, accurate boxes, because high thresholds only accept boxes that fit well.
This is why mAP50-95 is always lower than mAP50. They are not competing measures of the same thing. A big gap between them tells you the model finds objects but its boxes are loose. That might be a labelling problem, a resolution problem or a model-size problem.
Which metric should you use?
It depends on the job. Match the metric to the cost of mistakes.
| Situation | Look at first | Why |
|---|---|---|
| Safety alert where missing an event is dangerous | Recall at a chosen threshold | Misses are the costly error |
| Alerts sent to people who will ignore noisy systems | Precision at a chosen threshold | False alarms destroy trust |
| Counting objects | Both, plus count error on real footage | Over and under counts both bias the total |
| Measuring size or position precisely | mAP50-95 | Box tightness matters |
| Comparing two models in general | mAP50-95, then per-class AP | A broader, stricter summary |
| Presence only ("is there at least one?") | mAP50 or recall | Exact box fit is not needed |
For many production alerting tasks, the pair precision and recall at your operating threshold matters more than mAP. mAP is great for comparing models. It does not tell you how the system behaves at the one threshold you will deploy.
Getting the numbers from Ultralytics
from ultralytics import YOLO

model = YOLO("runs/detect/train/weights/best.pt")
metrics = model.val(data="data.yaml")

print("precision:", metrics.box.mp)
print("recall:   ", metrics.box.mr)
print("mAP50:    ", metrics.box.map50)
print("mAP50-95: ", metrics.box.map)
Here mp and mr are the mean precision and recall across classes, as reported by the validator. Note that validation uses its own settings, including a low confidence threshold used to trace out the curve, so the printed precision and recall are summary values and not what you would see at a typical deployment threshold. Check the documentation for the current defaults. The validation run also saves plots, such as a precision-recall curve and a confusion matrix, in its output folder. Open them. They tell you more than the single numbers.
The confusion matrix
The confusion matrix shows, for each real class, what the model predicted. Read it for patterns:
- A bright column or row for "background" means many missed objects or many false detections.
- Off-diagonal cells between two classes mean the model confuses them. That is usually a labelling or definition problem: are the two classes really different?
- A class that mostly lands in background may have too few examples or inconsistent boxes.
Common mistakes
- Reporting mAP on the training set. Always evaluate on data the model has never seen. For video, split by camera and time, not by random frame, otherwise the score is inflated. See Train/Validation Split for Video Frames.
- Using a tiny validation set. With a few dozen images, one object changes a metric noticeably. Treat small-set results as rough.
- Quoting one number. Give mAP50-95 with precision and recall and the threshold. State the image size and model.
- Ignoring class balance. Mean values can hide a failing rare class.
- Comparing numbers across datasets. A model scoring higher on an easy dataset is not better than one scoring lower on a hard one.
- Trusting metrics over footage. Scores are an average. Watch the failures on real video, including night, glare and crowding.
A practical routine
- Validate on a held-out set that looks like deployment.
- Read per-class AP and the confusion matrix, not just the headline.
- Decide which error is more costly: false alarms or misses.
- Choose a confidence threshold that gives acceptable precision and recall for that cost, as covered in Confidence Thresholds: Tuning a Detector to Cut False Alarms.
- Test that threshold on fresh real footage and count actual errors.
Key points
- Precision is how many reported detections were right. Recall is how many real objects were found.
- Both depend on the confidence threshold, so always state it.
- mAP summarises across thresholds and classes. mAP50 is lenient on box fit, mAP50-95 is strict.
- Choose the metric by the cost of mistakes, not by the biggest number.
- Check per-class results and the confusion matrix.
- Evaluate on data that is truly separate from training.
Next steps: Confidence Thresholds: Tuning a Detector to Cut False Alarms, How to Spot Overfitting in Object Detection and IoU and Non-Maximum Suppression.