What mAP Hides: Seven Things a Single Score Won't Tell You
mAP is the number everyone reports, and for good reason: it summarises a detector across classes and thresholds in one value, and it is computed the same way by most tools. But a summary is a compression, and compression throws things away. Two models with the same mAP can behave very differently on a real camera.
If the basics of precision, recall and mAP are new to you, start with mAP, Precision and Recall: How to Read Detection Results. This article assumes them and lists what the single number leaves out.
1. The threshold you will actually deploy
AP is the area under the precision-recall curve, so it rewards a model for every point on that curve. In production you run at one confidence threshold, which is one point. The area tells you little about that point.
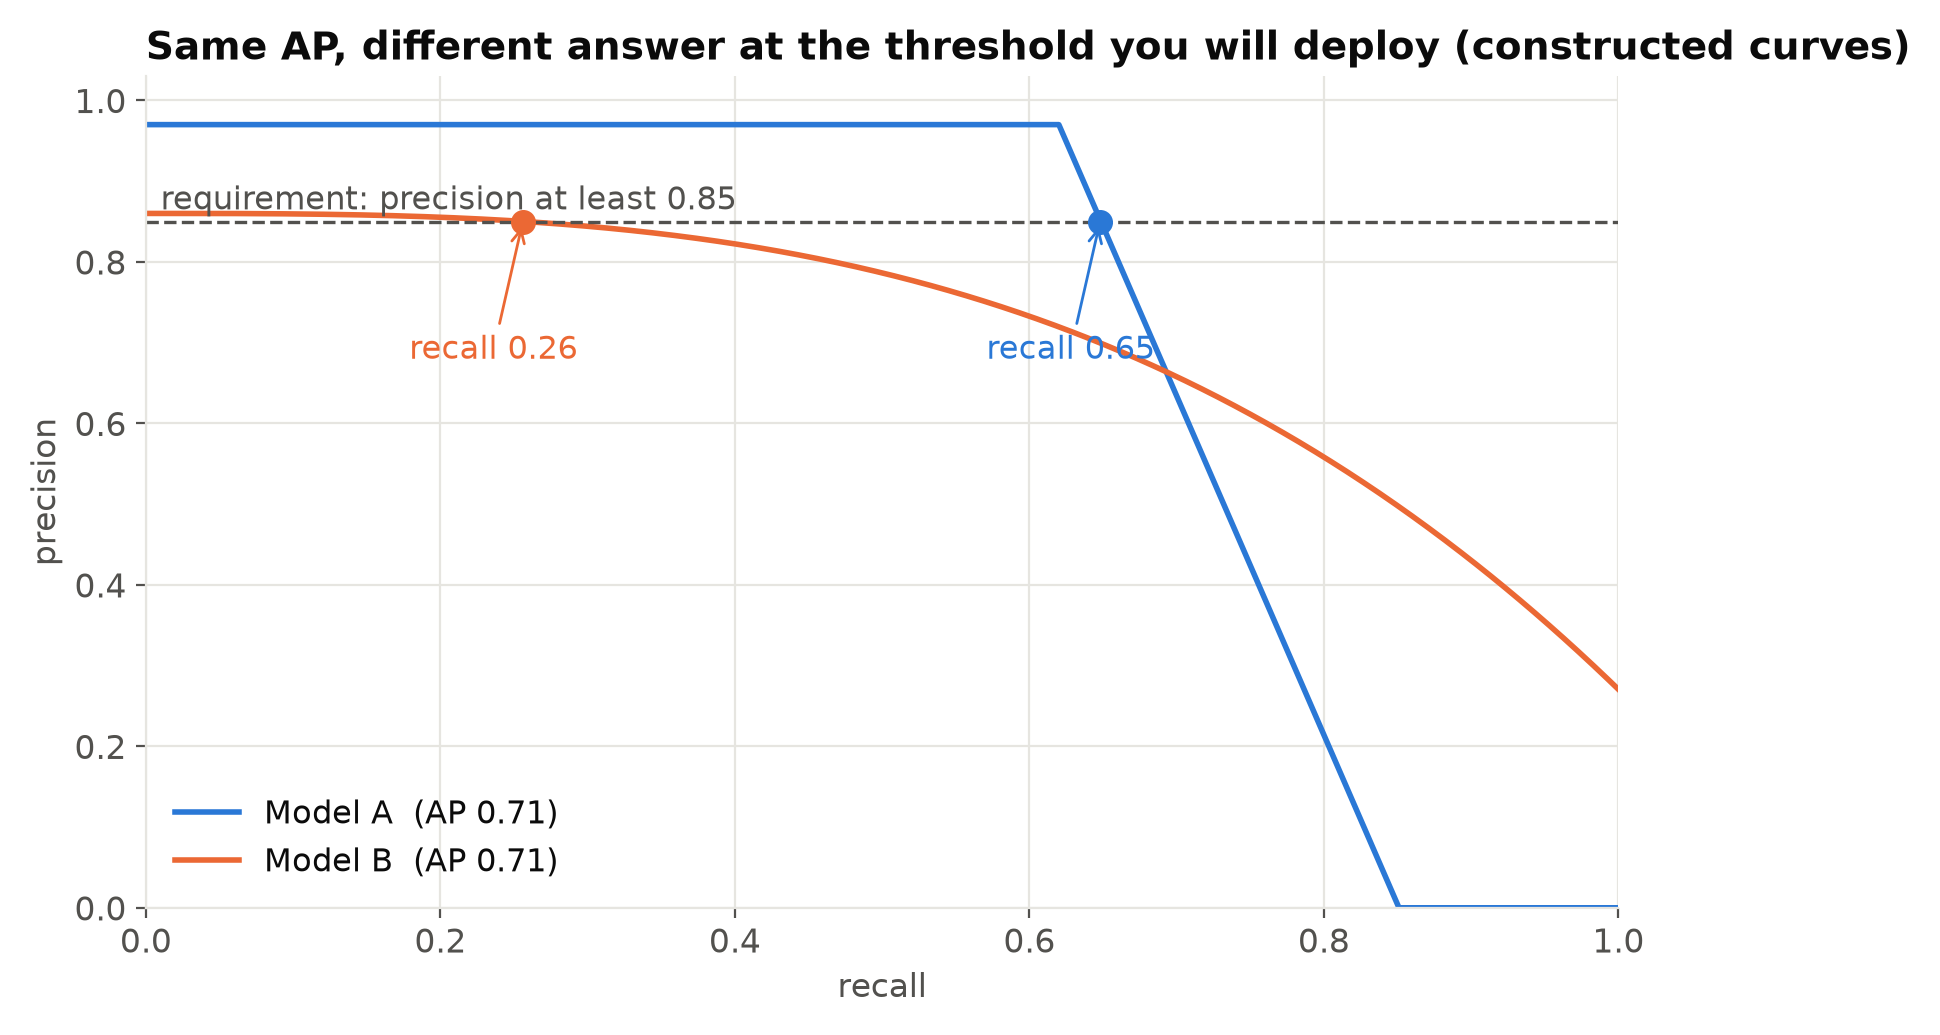
The curves above are constructed to have exactly the same area. If your alerting job needs high precision, model A is much better. If you need recall close to 1 and can tolerate noise, model B goes further. mAP calls them equal.
Decide your operating constraint first ("precision at least X" or "recall at least Y"), then compare models at that constraint. Ultralytics saves the precision-recall and F1 curves for each validation run; read off the operating point from those, not from the headline.
2. Which class is weak
mAP is a plain mean over classes, so every class counts the same, whatever its frequency or importance. A model can lose ten points on the one class your client cares about and gain a few points on three classes nobody cares about, and the mean barely moves.
Always read per-class AP. If some classes matter more than others, say so up front and report them separately, rather than inventing a weighted mAP that nobody else can reproduce.
Also check how many instances each class has in the test set. A class with 30 instances in the test set has a noisy AP; a few objects either way move it by several points. See Comparing Two Detectors Fairly for how large that noise is.
3. Object size
A detector can be excellent on large objects and poor on small ones, and the average hides which is which. The COCO evaluation reports AP separately for small (under 32 x 32 pixels), medium (32 to 96) and large (over 96) objects, measured by area in the original image. Ultralytics' built-in validation does not print these by default, but you can get them by exporting predictions to COCO JSON and running pycocotools.
Size matters because size in production is not size in your test set. If your cameras are mounted higher than the ones in the dataset, everything is smaller, and the small-object AP is the number that predicts what you will see. See Class Imbalance and Small Objects.
4. What kind of mistakes it makes
A false positive can be many different things: a box in the right place with the wrong class, a correct class with a loose box, a duplicate of a correct box, or a detection on pure background. Each needs a different fix. mAP counts them all the same.
Tools such as TIDE (Bolya et al., 2020) split the lost AP into error types: classification, localisation, both, duplicates, background and missed objects. A rougher manual version works too: sample 50 false positives and 50 misses at your operating threshold and sort them by hand. The confusion matrix from the validator helps for class confusion, but it does not show localisation errors.
5. How tight the boxes need to be
mAP50 accepts a box at IoU 0.5, which is loose. mAP50-95 averages over IoU thresholds up to 0.95, which is strict. Neither might match your use. A counting system often only needs the right number of boxes in roughly the right places. A system that measures distances or checks whether a box crosses a line near a doorway needs tight boxes along one edge in particular, such as the feet of a person.
If localisation quality matters for your rule, look at how it fails for your rule. For line crossing, for example, measure the error in the bottom edge of the box, not IoU.
6. How the number was computed
Different tools compute AP in slightly different ways, and the differences are not tiny:
- Interpolation. The old Pascal VOC metric used 11 recall points; later VOC versions used all points; COCO uses 101 points. Ultralytics uses a 101-point interpolation by default.
- Maximum detections per image. COCO evaluation keeps at most 100 detections per image. In very crowded scenes this caps recall.
- Crowd and ignore regions. COCO marks some annotations as
iscrowd, and matches to them are ignored. Your own dataset may have no such concept. - Confidence threshold during validation. Ultralytics validates with a very low confidence threshold (0.001 by default) to trace the whole curve. Running validation at your deployment threshold gives a different, lower mAP.
So a number from one tool should only be compared with a number from the same tool and version, with the same settings. A paper's number and your Ultralytics number are not directly comparable even on the same dataset.
7. Time
mAP is computed per image. Video adds a dimension it cannot see. A detector that finds a person in 60% of frames, scattered at random, and one that finds the person in a solid 60% block of consecutive frames have similar frame-level numbers. With a temporal filter on top, the first may produce flickering tracks and broken counts, and the second clean events.
If your system raises alerts or counts, the right unit is the event, not the frame. Measuring Video Analytics by Events, Not Frames covers how to score that.
What to report instead of one number
When you compare models or report results to a client, a short table goes a long way:
| Item | Why |
|---|---|
| mAP50-95 and mAP50 | The standard summary, for comparison with other work |
| Precision and recall at the deployment threshold | What the system will actually do |
| Per-class AP, with instance counts | Which classes are weak, and how noisy each number is |
| AP by object size, if sizes vary | Predicts behaviour at other mounting heights |
| Tool, version, image size, validation settings | So someone else can reproduce it |
| Event-level results on a few hours of real footage | What an operator will see |
This takes an afternoon longer than quoting mAP. It also tends to change which model you pick.
Checklist
- Fix the operating constraint before comparing models.
- Read per-class AP and the number of instances behind each.
- Check AP by object size when sizes vary between sites.
- Sort a sample of errors by type before deciding on a fix.
- Match the localisation measure to the rule the boxes feed.
- Only compare numbers computed with the same tool and settings.
- For video, evaluate events as well as frames.
Next steps: Confidence Thresholds: Tuning a Detector to Cut False Alarms and Why Your Test Set Flatters You.