Metrics and Logging for a Vision Service
A vision service can fail in many quiet ways: a camera delivers frames at half rate, inference latency creeps up, a model starts producing fewer detections after a site change, alerts stop being delivered. None of these crash the process. Without metrics you learn about them from the client.
This article lists the metrics worth collecting from a video analytics service, how to organise them by stage and by camera, and how to write logs that help rather than drown you.
Metrics and logs do different jobs
- Metrics are numbers over time: frames per second, latency, detections per minute. They are cheap to store, easy to graph and alert on, and tell you that something changed.
- Logs are records of individual events: a reconnect, an alert sent, an error with its stack trace. They tell you what happened and why.
You need both. Metrics show the camera whose detection count fell to zero on Tuesday; logs show that its stream reconnected 40 times that morning.
The pipeline, stage by stage
Collect metrics at each stage, labelled by camera, so a problem can be placed precisely.
| Stage | Metrics | What a change suggests |
|---|---|---|
| Stream | Connected (yes/no), reconnects, frames received per second, seconds since last frame | Network, camera or credential problems; frame-rate changes at night |
| Decode | Decode errors, decode time | Corrupt streams, CPU overload, codec issues |
| Queue | Queue length, frames dropped | Inference cannot keep up |
| Inference | Latency per frame (histogram), frames processed per second, batch size | Throttling, contention, model change |
| Detections | Detections per minute per class, mean confidence | Scene change, camera moved, model drift, blind camera |
| Rules and alerts | Alerts raised per rule, alerts suppressed by cooldown | Rule misconfiguration, false-alarm source |
| Delivery | Alerts delivered, delivery failures, delivery delay | Notification service or network problems |
| Health checks | Sharpness ratio, brightness, view shift, day/night mode | Dirty, blocked or moved camera |
| Device | CPU, GPU, memory, temperature, throttle flags, disk free | Overload, leaks, heat, full disks |
Two derived numbers are particularly useful. Frames processed versus frames received per camera shows whether you are falling behind. End-to-end delay, from frame arrival to alert delivery, is the latency the client experiences.
Watch the absence of signal
The most important failures produce silence. A blind camera produces no detections. A broken notification path produces no alerts. A stuck process produces no metrics at all.
So alert on absence:
- Seconds since the last frame, per camera.
- Detections per hour dropping to zero on a camera that normally has activity at that hour.
- No alerts delivered for unusually long, compared with that camera's history.
- No metrics received from a device at all.
The detection-count check needs care, because a quiet scene is normal at night or at weekends. Compare with the same hour on previous days, not with a fixed number.
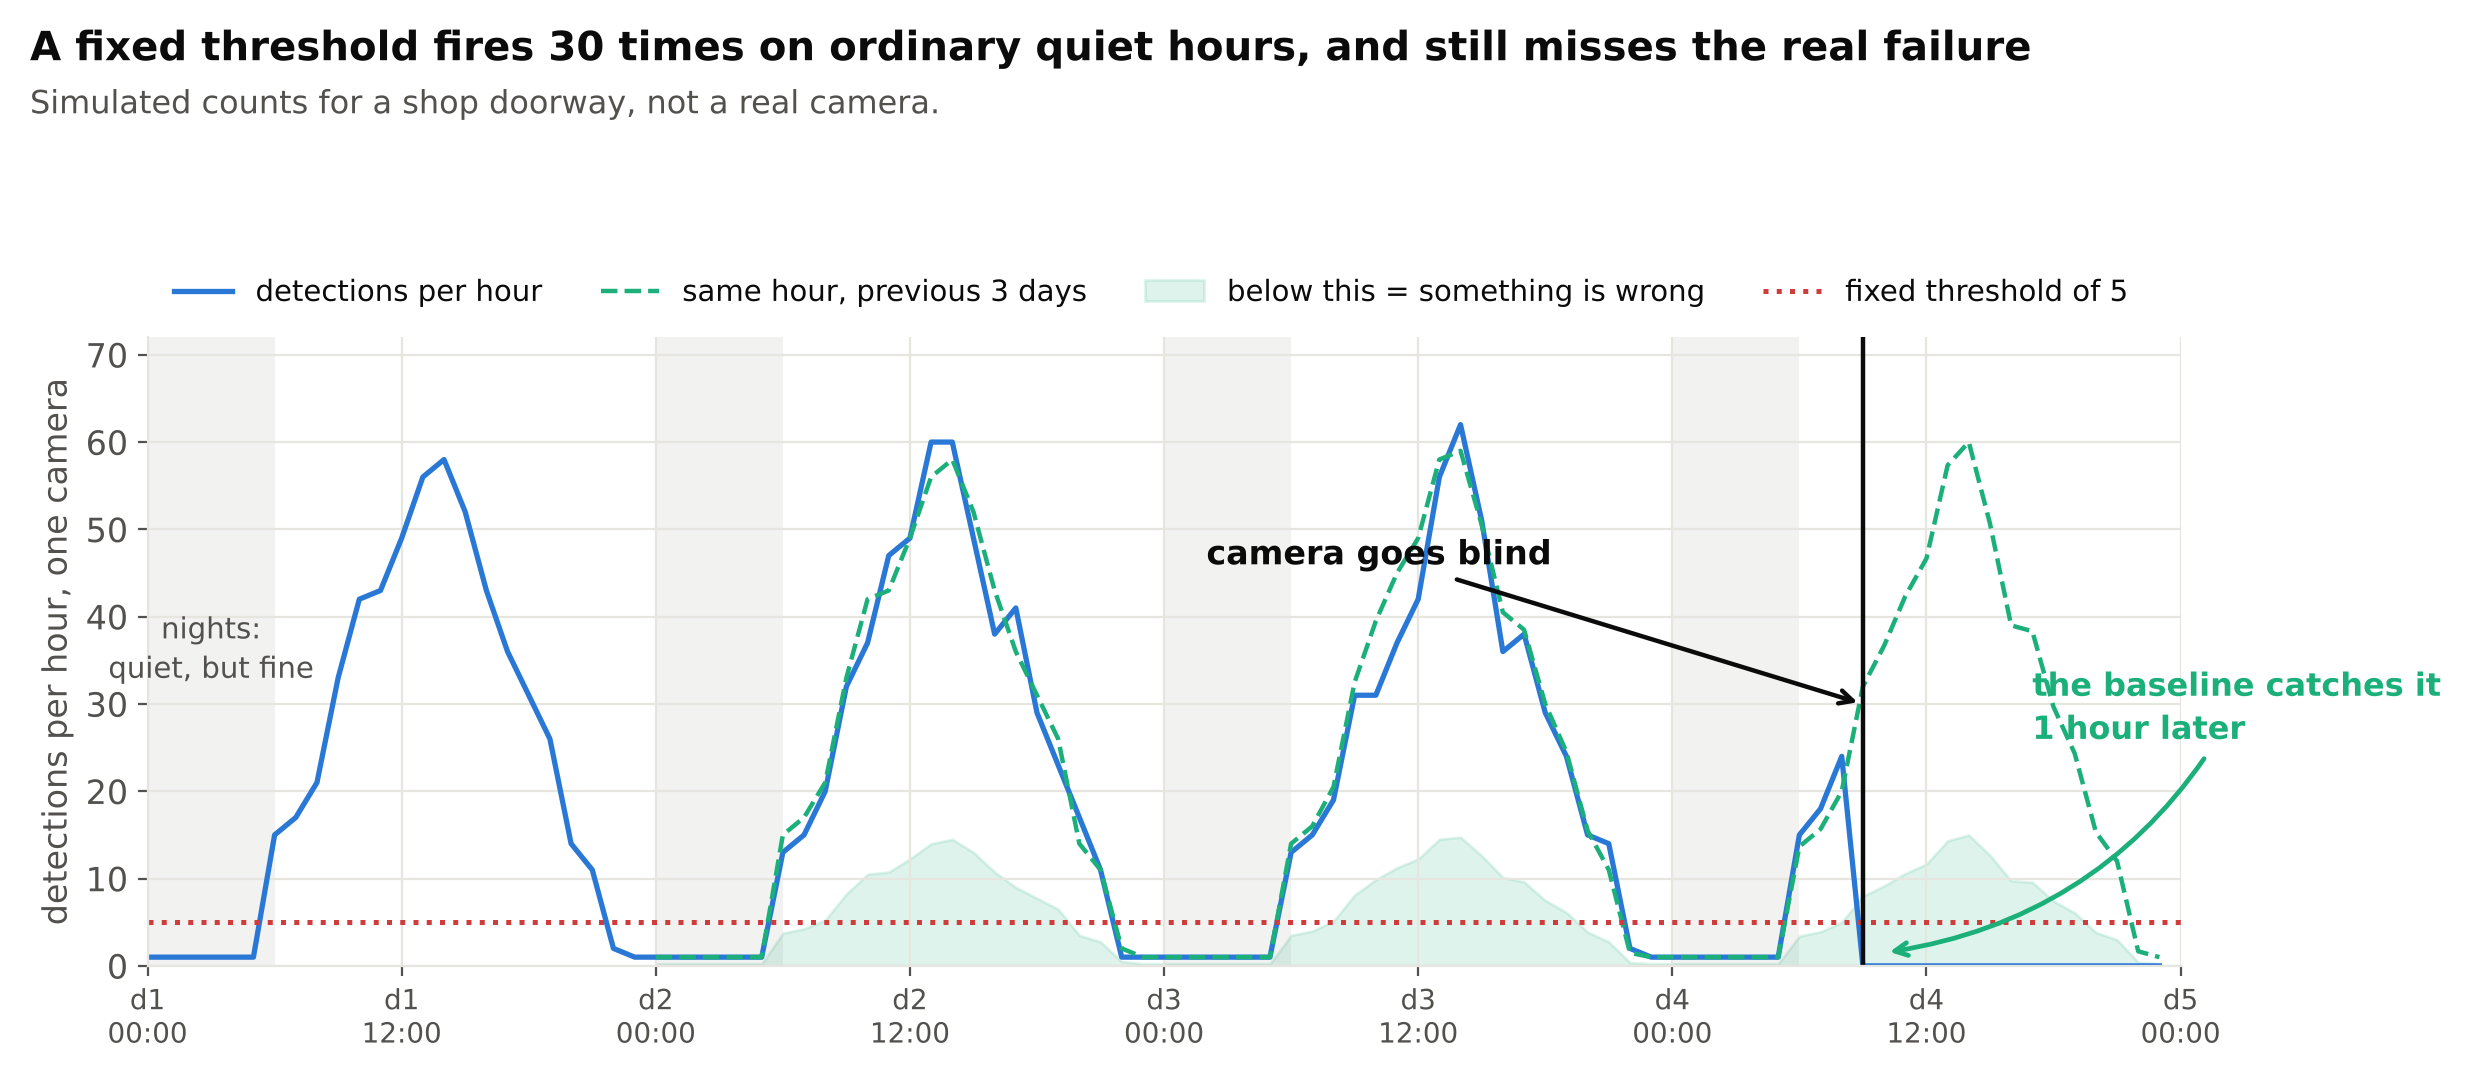
The two lines get identical data. A fixed threshold of five fires on 30 ordinary quiet hours across those four days, which is enough to train everyone to ignore it, and when the camera actually fails at nine in the morning it says nothing, because nine in the morning is above five right up until it isn't.
The baseline catches the same failure within an hour, and stays silent through every night, because it is asking a different question. Not "is this number low?" but "is this number low for this hour on this camera?" That is the whole trick, and it costs you a rolling average rather than a model. Handling RTSP Dropouts and Detecting a Dirty, Blocked or Moved Camera cover the stream and image checks behind these numbers.
Using Prometheus-style metrics
A common setup is to expose metrics from each service with a Prometheus client library, collect them with Prometheus, and graph them in Grafana. Choose the right metric type:
- Counters for things that only go up: frames received, alerts raised, errors. Rates are computed from them.
- Gauges for current values: queue length, temperature, connected or not.
- Histograms for distributions: inference latency, end-to-end delay. They let you see percentiles, not only averages, which matters because the slow tail is what users notice. See Measuring FPS and Latency Correctly.
from prometheus_client import Counter, Gauge, Histogram, start_http_server

FRAMES = Counter("frames_received_total", "Frames received", ["camera"])
DROPPED = Counter("frames_dropped_total", "Frames dropped before inference", ["camera"])
LAST_FRAME = Gauge("last_frame_timestamp_seconds", "Time of last frame", ["camera"])
INFER = Histogram("inference_seconds", "Inference latency", ["model"],
                  buckets=[0.005, 0.01, 0.02, 0.04, 0.08, 0.16, 0.32, 0.64])
DETS = Counter("detections_total", "Detections above threshold", ["camera", "cls"])

start_http_server(9100)
Be careful with labels. Each unique combination of label values becomes a separate time series. Labels for camera, class and model are fine, even across hundreds of cameras. Labels for track IDs, frame numbers or timestamps create an unbounded number of series and will overload the metrics system.
Logging that helps
- Structured logs. Write one JSON object per line with fixed fields: time, level, camera, stage, message, and relevant IDs. Structured logs can be searched and filtered; free text cannot.
- Log events, not frames. Log a reconnect, a mode switch, an alert, a configuration change. Do not log every frame; at 25 frames per second per camera that buries everything else.
- Log alerts with context. For each alert: camera, rule, track ID, confidence, model version, and a reference to the saved snapshot. This is what you need when a client questions an alert. Hard Negative Mining from Production Footage reuses the same records.
- Log configuration and version at start-up. Model version, thresholds version, code version and camera list. When behaviour changes, the first question is what changed.
- Use wall-clock time in UTC with time zone stated, and synchronise the server clock. See Alerts at the Wrong Time of Day.
- Rate-limit repeating errors. A camera that is down should log "still down" once a minute, not a stack trace every 100 ms.
Keep personal data out of logs where possible. Stream URLs often contain credentials; strip them before logging.
Dashboards and alerts
Build one overview dashboard that answers "is everything working?" at a glance: cameras connected, cameras behind, cameras with health problems, devices hot or full, alerts delivered in the last hour. Then per-camera dashboards for investigation.
Alert on the few conditions that need a person: a camera down for more than a few minutes, a device not reporting, delivery failing, a disk nearly full, a camera with zero detections when it should have some. Route them to whoever can fix them, with a cooldown. Everything else belongs on a dashboard, not in someone's phone.
Checklist
- Metrics at every stage, labelled by camera.
- Frames received versus processed, and end-to-end delay.
- Alerts on absence: no frames, no detections, no deliveries, no metrics.
- Counters, gauges and histograms used for the right things.
- No unbounded labels such as track IDs.
- Structured logs of events, with alert context and start-up versions.
- Credentials stripped from logs.
- One overview dashboard; alerts only for what needs a person.
Next steps: Scaling Video Analytics to Hundreds of Camera Streams and Watchdogs and Self-Recovery for Unattended Edge Boxes.