Memory Budgets on Small Boards: What Actually Fits
On a small board, the first limit you hit is often memory, not speed. The pipeline runs fine with two cameras, then with the fourth the process is killed without a Python traceback, or the board starts swapping and everything slows to a crawl. The model itself is rarely the culprit. Frames, buffers and libraries usually are.
This article goes through where memory goes in a detection pipeline on a device such as a Raspberry Pi or a Jetson, how to measure it, and how to bring it down.
Know what you have
Start with the total and what is left for you:
- Raspberry Pi boards ship with different amounts of RAM depending on the model and variant. The operating system, desktop (if installed) and services take some of it before your code starts. A headless OS image leaves more.
- Jetson boards share one pool of memory between the CPU and the GPU. A model on the GPU, CUDA libraries and the frames you copy to it all come out of the same pool as your Python process. There is no separate graphics memory to fall back on.
Check with free -h on a freshly booted board, with your services running but not your pipeline. That number, minus a safety margin, is your budget.
Where the memory goes
Decoded frames
This is the largest and most underestimated item. A decoded frame is big: width × height × 3 bytes for BGR. A 1080p frame is about 6.2 MB; a 4K frame is about 25 MB. Compressed video is small; decoded video is not.
Frames pile up in several places at once: inside the decoder, in a capture library's buffer, in your own queue between threads, and in copies made during pre-processing. A queue that holds 30 frames per camera is easy to write and expensive to run.
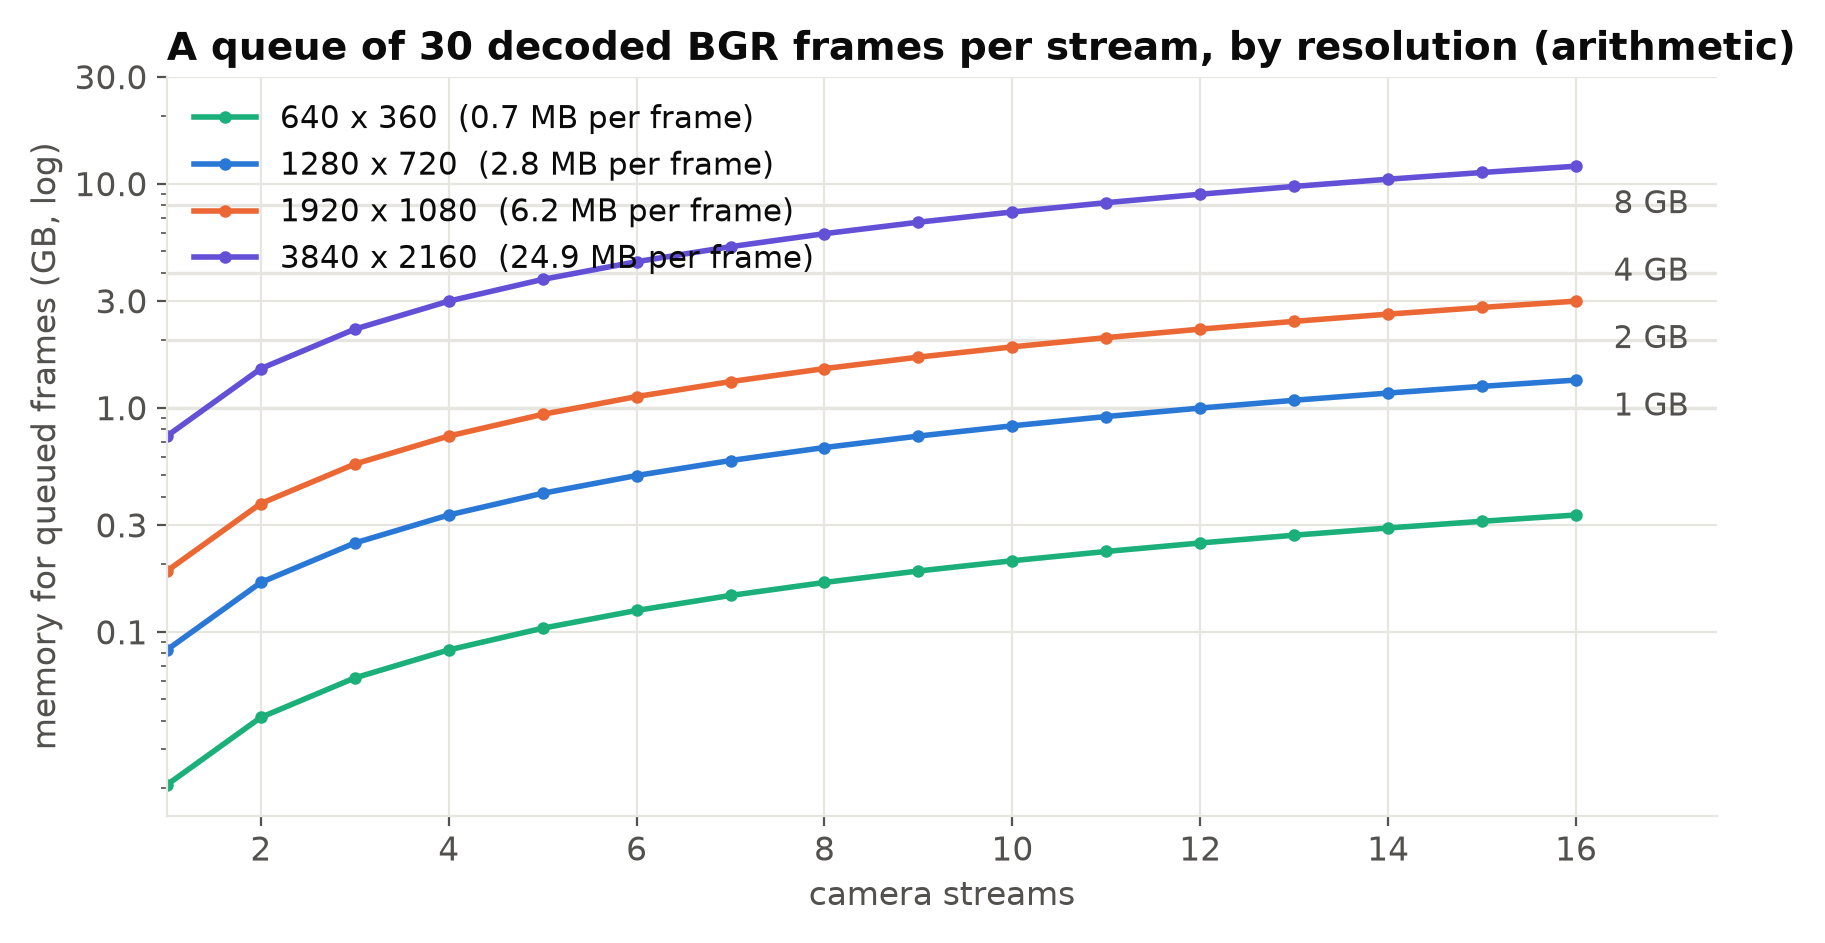
For live analytics you almost never need a deep queue. You want the latest frame, not a backlog. Keep the queue between capture and inference at one or two frames per camera and drop older ones. That also keeps latency low. Reading RTSP Streams with OpenCV and FFmpeg shows the "latest frame only" pattern.
Resolution is the other lever. If the model runs at 640 × 640, decoding 4K and holding 4K frames in memory is wasted. Use the camera's substream where it is good enough; see Main Stream or Substream.
The runtime and libraries
Importing a deep learning framework costs memory before any model is loaded. PyTorch with CUDA support, in particular, loads large libraries. For inference only, a lighter runtime such as ONNX Runtime or TensorRT usually needs less, and does not need the training framework installed at all. See Export YOLO to ONNX and Run It with ONNX Runtime.
Measure rather than guess: start Python, import your runtime, load the model, and look at the process's resident memory (VmRSS in /proc/<pid>/status, or ps -o rss). Then run one inference and look again, because many runtimes allocate their working buffers on first use.
The model
Weights are usually the smallest item. A detector's parameter count multiplied by the bytes per parameter gives a rough size: about 4 bytes each in FP32, 2 in FP16, 1 in INT8. Ultralytics lists YOLOv8n at about 3.2 million parameters, which is roughly 13 MB in FP32. Even the larger YOLO variants have weights in the tens to a few hundred megabytes.
Activations, the intermediate results inside the network, add to this during inference. They grow with input size and batch size. Doubling the input size roughly quadruples the activation memory of the early layers, and a batch of eight needs roughly eight times the activations of a batch of one.
Building engines on the device
TensorRT builds an optimised engine on the target device, and the build can need much more memory than running the engine later, because it tries different implementations. A build that fails on a small Jetson while the pipeline is running may succeed with everything else stopped. Build once, save the engine file, and load it at start-up. See TensorRT for YOLO.
Everything else
Tracking state, alert snapshots waiting to be uploaded, logs held in memory, a web dashboard: small items that grow with time. Watch for slow growth over days. A process that gains a few megabytes an hour will eventually be killed.
How to measure
- Baseline:
free -hafter boot, without the pipeline. - Per process: resident memory of the pipeline process after start-up, after the first inference and after an hour.
- Per camera: add cameras one at a time and note the increase. If each camera adds far more than a few frames' worth, look for queues and copies.
- Over time: log resident memory every few minutes during a multi-day test and plot it. A rising line is a leak.
- On Jetson:
tegrastatsshows total RAM use, which includes GPU allocations.
The kernel's out-of-memory killer leaves a trace in the system log (dmesg or journalctl -k), mentioning the killed process. If your pipeline disappears without a Python error, look there first.
Swap is not a plan
Adding swap stops immediate crashes, but on an SD card it is slow and wears the card. If a pipeline needs swap in normal operation, it will be slow when it swaps, and latency becomes unpredictable. Compressed swap in RAM (zram) is a better safety net on some systems, but it should still only cover rare peaks. Size the pipeline to fit in RAM. Power, Cooling and Storage for a Reliable Edge AI Box covers storage wear.
Ways to cut memory, roughly in order of effect
- Keep queues to one or two frames per camera, dropping old frames.
- Decode at the resolution you need: substreams, or a resize inside the decoder where supported.
- Avoid copies: resize once, reuse buffers, avoid converting the same frame to several formats.
- Use an inference runtime rather than the training framework.
- Use FP16 where supported; it halves weight memory and activations.
- Use batch size 1 unless you have measured a benefit from batching.
- Run one model instance shared by all cameras, rather than one per camera.
- Move non-essential services off the device.
Checklist
- Know the free memory on a booted board without your pipeline.
- Count frames held per camera in every queue and buffer.
- Measure resident memory after load, after first inference and per added camera.
- Prefer inference runtimes over training frameworks on the device.
- Build TensorRT engines once, with other work stopped.
- Log memory over multi-day tests and look for growth.
- Check the kernel log when the process disappears.
- Leave a margin; do not rely on swap.
Next steps: Thermal Throttling on Edge Devices and Hardware Video Decoding on Edge Devices.