Profiling a Python Vision Pipeline: Finding the Real Bottleneck
A pipeline is too slow, so the model gets smaller, or gets exported to TensorRT, or gets quantised. Throughput barely moves. The model was taking a fraction of the time. The rest went on decoding, colour conversions, copies, drawing boxes nobody looks at, and encoding snapshots, all in Python.
Optimising without measuring is guessing. This article describes a simple order of work for finding where a Python vision pipeline spends its time, and the hidden costs that turn up again and again.
Step 1: measure the whole thing
Start with the number you care about, measured properly: end-to-end throughput per camera and latency from frame arrival to result, with all cameras running, after warm-up, for long enough that temperatures settle. Measuring FPS and Latency Correctly describes the method. Write the number down. Every later change is judged against it.
Also note resource use during the run: CPU per core, GPU or accelerator use, memory. A pipeline at 100% on one CPU core and idle elsewhere has a different problem from one at 100% on all cores.
Step 2: time each stage
Wrap each stage in a timer and record the time per frame:
import time
from collections import defaultdict
import numpy as np

timings = defaultdict(list)

class stage:
    def __init__(self, name): self.name = name
    def __enter__(self): self.t0 = time.perf_counter()
    def __exit__(self, *a): timings[self.name].append((time.perf_counter() - self.t0) * 1000)

# in the loop
with stage("decode"):  ok, frame = cap.read()
with stage("preprocess"): x = preprocess(frame)
with stage("inference"): out = session.run(None, {"images": x})
with stage("postprocess"): dets = postprocess(out)
with stage("track_rules"): events = rules.update(tracker.update(dets))
with stage("output"): handle(events, frame)

# every few hundred frames
for k, v in timings.items():
    print(f"{k:12s} median {np.median(v):6.2f} ms   p95 {np.percentile(v, 95):6.2f} ms")
If inference runs on a GPU asynchronously, make sure the inference stage includes waiting for the result, or its time will look tiny and the next stage will absorb it.
The stage table usually points straight at the problem. If inference is a third of the total, making the model twice as fast saves a sixth.
Step 3: profile inside the slow stage
Once you know which stage is slow, find out why with a profiler:
- cProfile, built into Python, shows time per function. Good for a single script run:
python -m cProfile -o out.prof app.py, then explore with a viewer such assnakeviz. - py-spy, a sampling profiler, attaches to a running process without changing code and with low overhead:
py-spy top --pid <pid>orpy-spy record -o profile.svg --pid <pid>for a flame graph. Useful on a live device. - line_profiler shows time per line in chosen functions, when you have narrowed it down to one function.
Profilers mainly see Python code. Time spent inside OpenCV, NumPy or an inference runtime appears as one call. That is fine: it tells you which call to look at.
The usual hidden costs
Work on full-resolution frames
Anything done on a 1080p or 4K frame costs many times more than the same work on the model's input. Colour conversion, normalisation and copies are the common cases. Resizing first and converting after gives the same model input at a fraction of the cost.
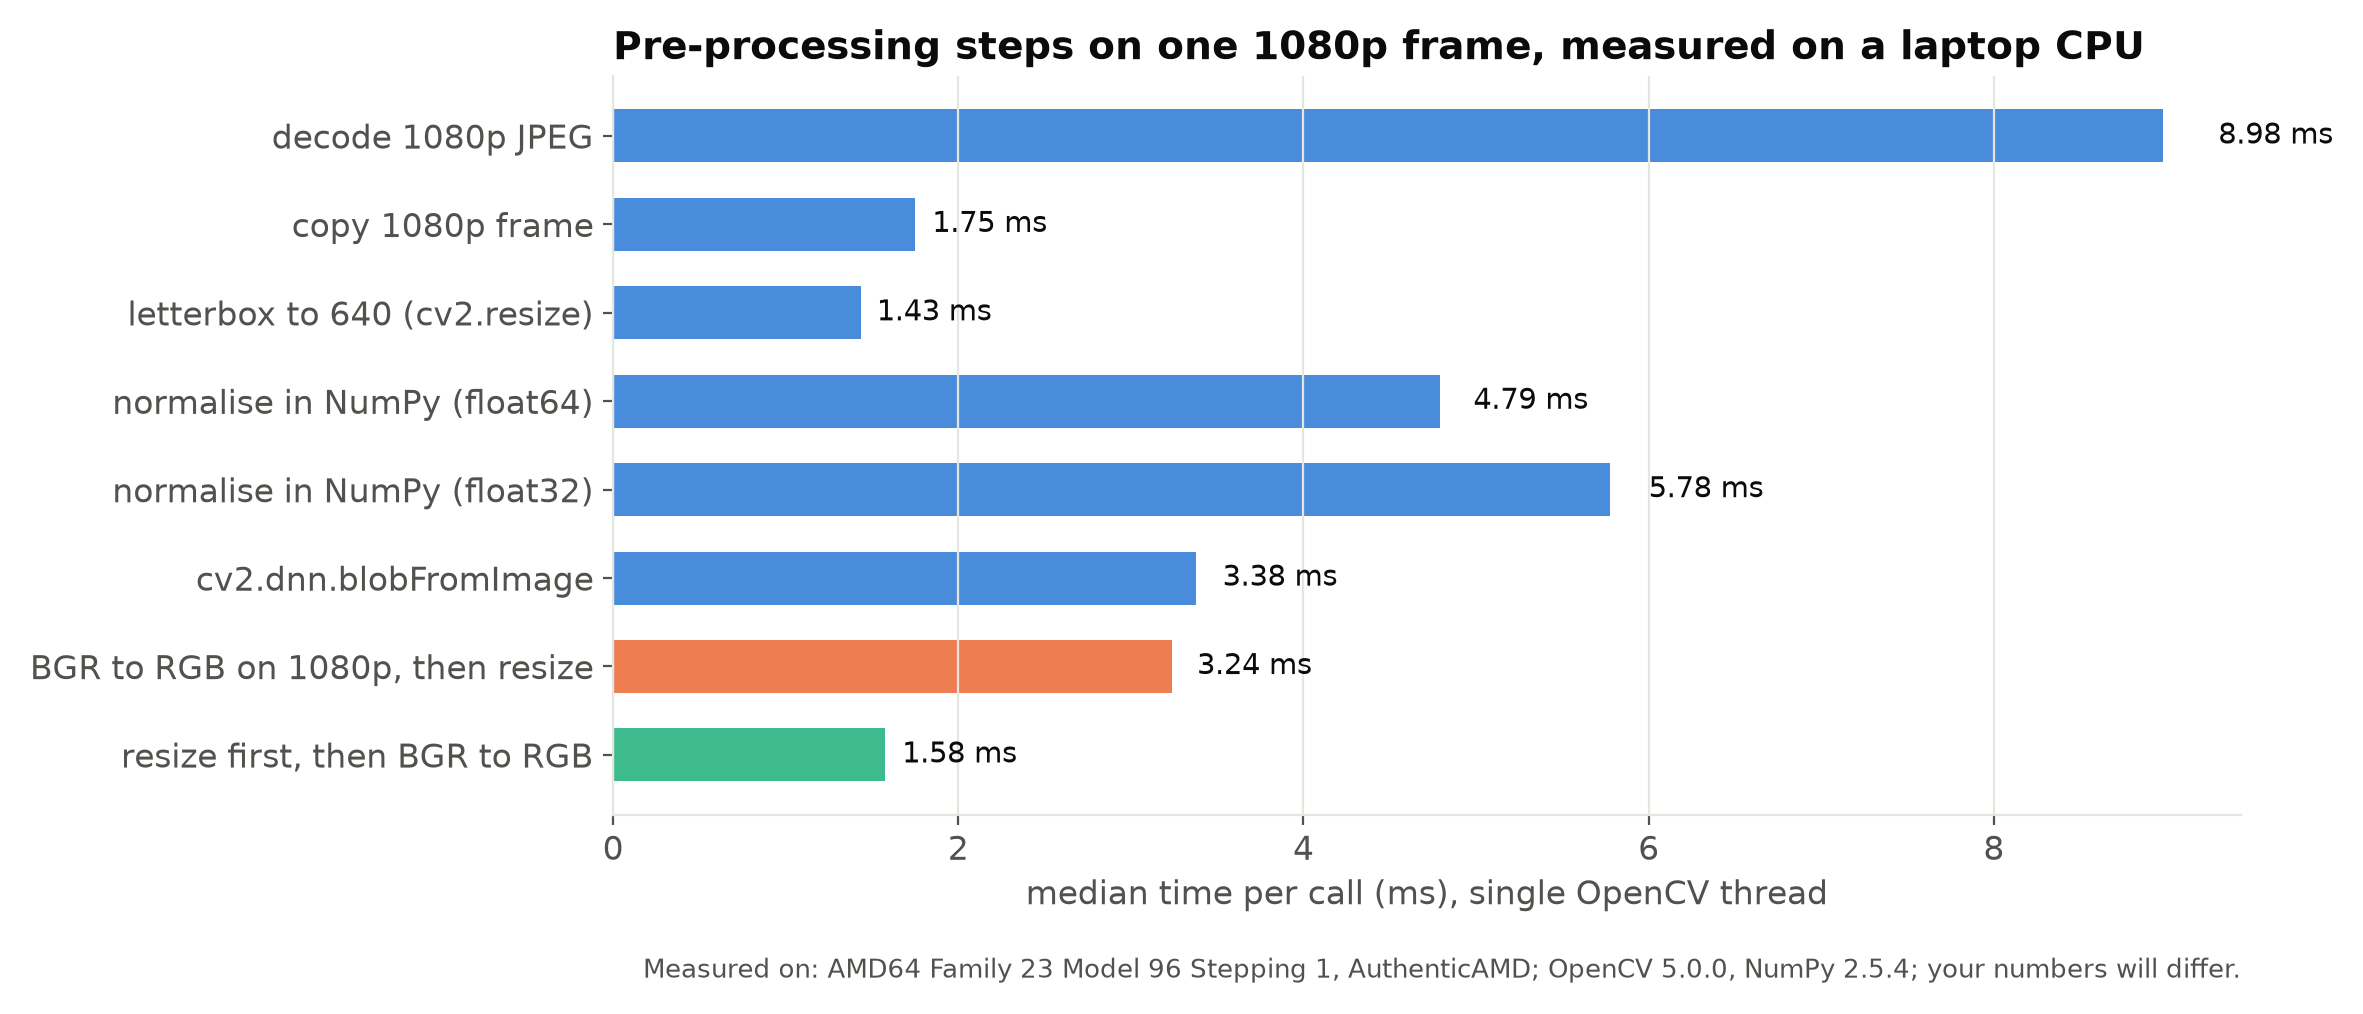
The figure shows real timings from one laptop. Note two things. Converting colour before resizing took about twice as long as resizing first. And a plausible-looking float32 version of the NumPy normalisation was not faster than the float64 one here, because of the extra passes over the data. Small changes in how array code is written can matter more than the data type, so measure rather than assume.
Copies
frame.copy(), slicing with a step, NumPy operations that create new arrays, conversions between libraries. Each full-resolution copy costs time and memory. Look for copies made "just in case".
Drawing and encoding
Drawing boxes on every frame and encoding them as JPEG for a preview stream nobody watches is a common waste. So is encoding a full-resolution snapshot for every detection rather than for every alert. Draw and encode only what is actually viewed or stored.
Python loops over pixels or boxes
A Python for loop over pixels is extremely slow; over thousands of candidate boxes before NMS it is slow too. Use vectorised NumPy or library functions. A loop over the few final detections per frame is fine.
Logging and I/O in the loop
Writing a log line per frame, saving images synchronously, or sending network requests from the frame loop blocks processing. Move I/O to a separate thread or process with a queue, and log events rather than frames. See Metrics and Logging for a Vision Service.
Threads and the GIL
Python threads cannot run Python code in parallel, because of the global interpreter lock. Many OpenCV and NumPy operations release the lock while they work, so threads can still help for decoding and some pre-processing. But a pipeline doing a lot of pure Python per frame across many cameras may need multiple processes. Profile before redesigning; the change is significant.
Library thread settings
OpenCV, NumPy's linear algebra library and inference runtimes may each start their own thread pools. With several cameras in parallel, they compete for cores and can slow each other down. Setting thread counts explicitly (for example cv2.setNumThreads, or the runtime's own options) sometimes improves total throughput.
Change one thing, measure again
After each change, re-run the end-to-end measurement from step 1 and the stage table. Keep changes that help, revert those that do not, and write down both. Several small fixes to pre-processing and output often beat any model change, and cost nothing in accuracy.
Checklist
- Measure end-to-end throughput and latency with all cameras first.
- Time every stage, including decode and output.
- Profile inside the slowest stage with cProfile or py-spy.
- Avoid work and copies at full resolution; resize early.
- Draw and encode only what is viewed or stored.
- Vectorise loops over boxes and pixels.
- Move logging and I/O off the frame loop.
- Check library thread settings when running many streams.
- Re-measure after every change.
Next steps: Hardware Video Decoding on Edge Devices and Preprocessing Mismatches That Silently Cost Accuracy.