Writing a Results Report a Non-Technical Client Will Read
You finish a test round, write a careful report with mAP50-95, a precision-recall curve and a confusion matrix, and send it. The client replies: "So, does it work?" Nobody read past the first page, and the first page did not answer their question.
A results report for a client is not a paper. Its job is to help someone make a decision: go ahead, change something, or stop. This article describes a structure that gets read, and the habits that make the numbers trustworthy to non-specialists.
Know the decision
Before writing, ask what the reader will decide after reading. Typical decisions:
- Is the prototype good enough to move to a pilot?
- Did the pilot meet the agreed target?
- Should we fix the cameras, add data, or accept the current level?
- Can we switch alerts on for the operators?
Write the report to answer that question. Everything that does not help with it goes to an appendix.
The structure
1. A one-paragraph answer
Start with the conclusion, in plain words, with the key numbers:
On 48 hours of footage from cameras 3 and 7, the system detected 41 of 44 loading-bay entries (93%) within 10 seconds, with an average of 1.5 false alerts per camera per day. This meets the agreed target. All three misses were at night beyond 25 metres. We recommend starting the pilot on these two cameras and adding a light at the far end before extending to camera 9.
A busy manager can stop reading there and still make the right decision.
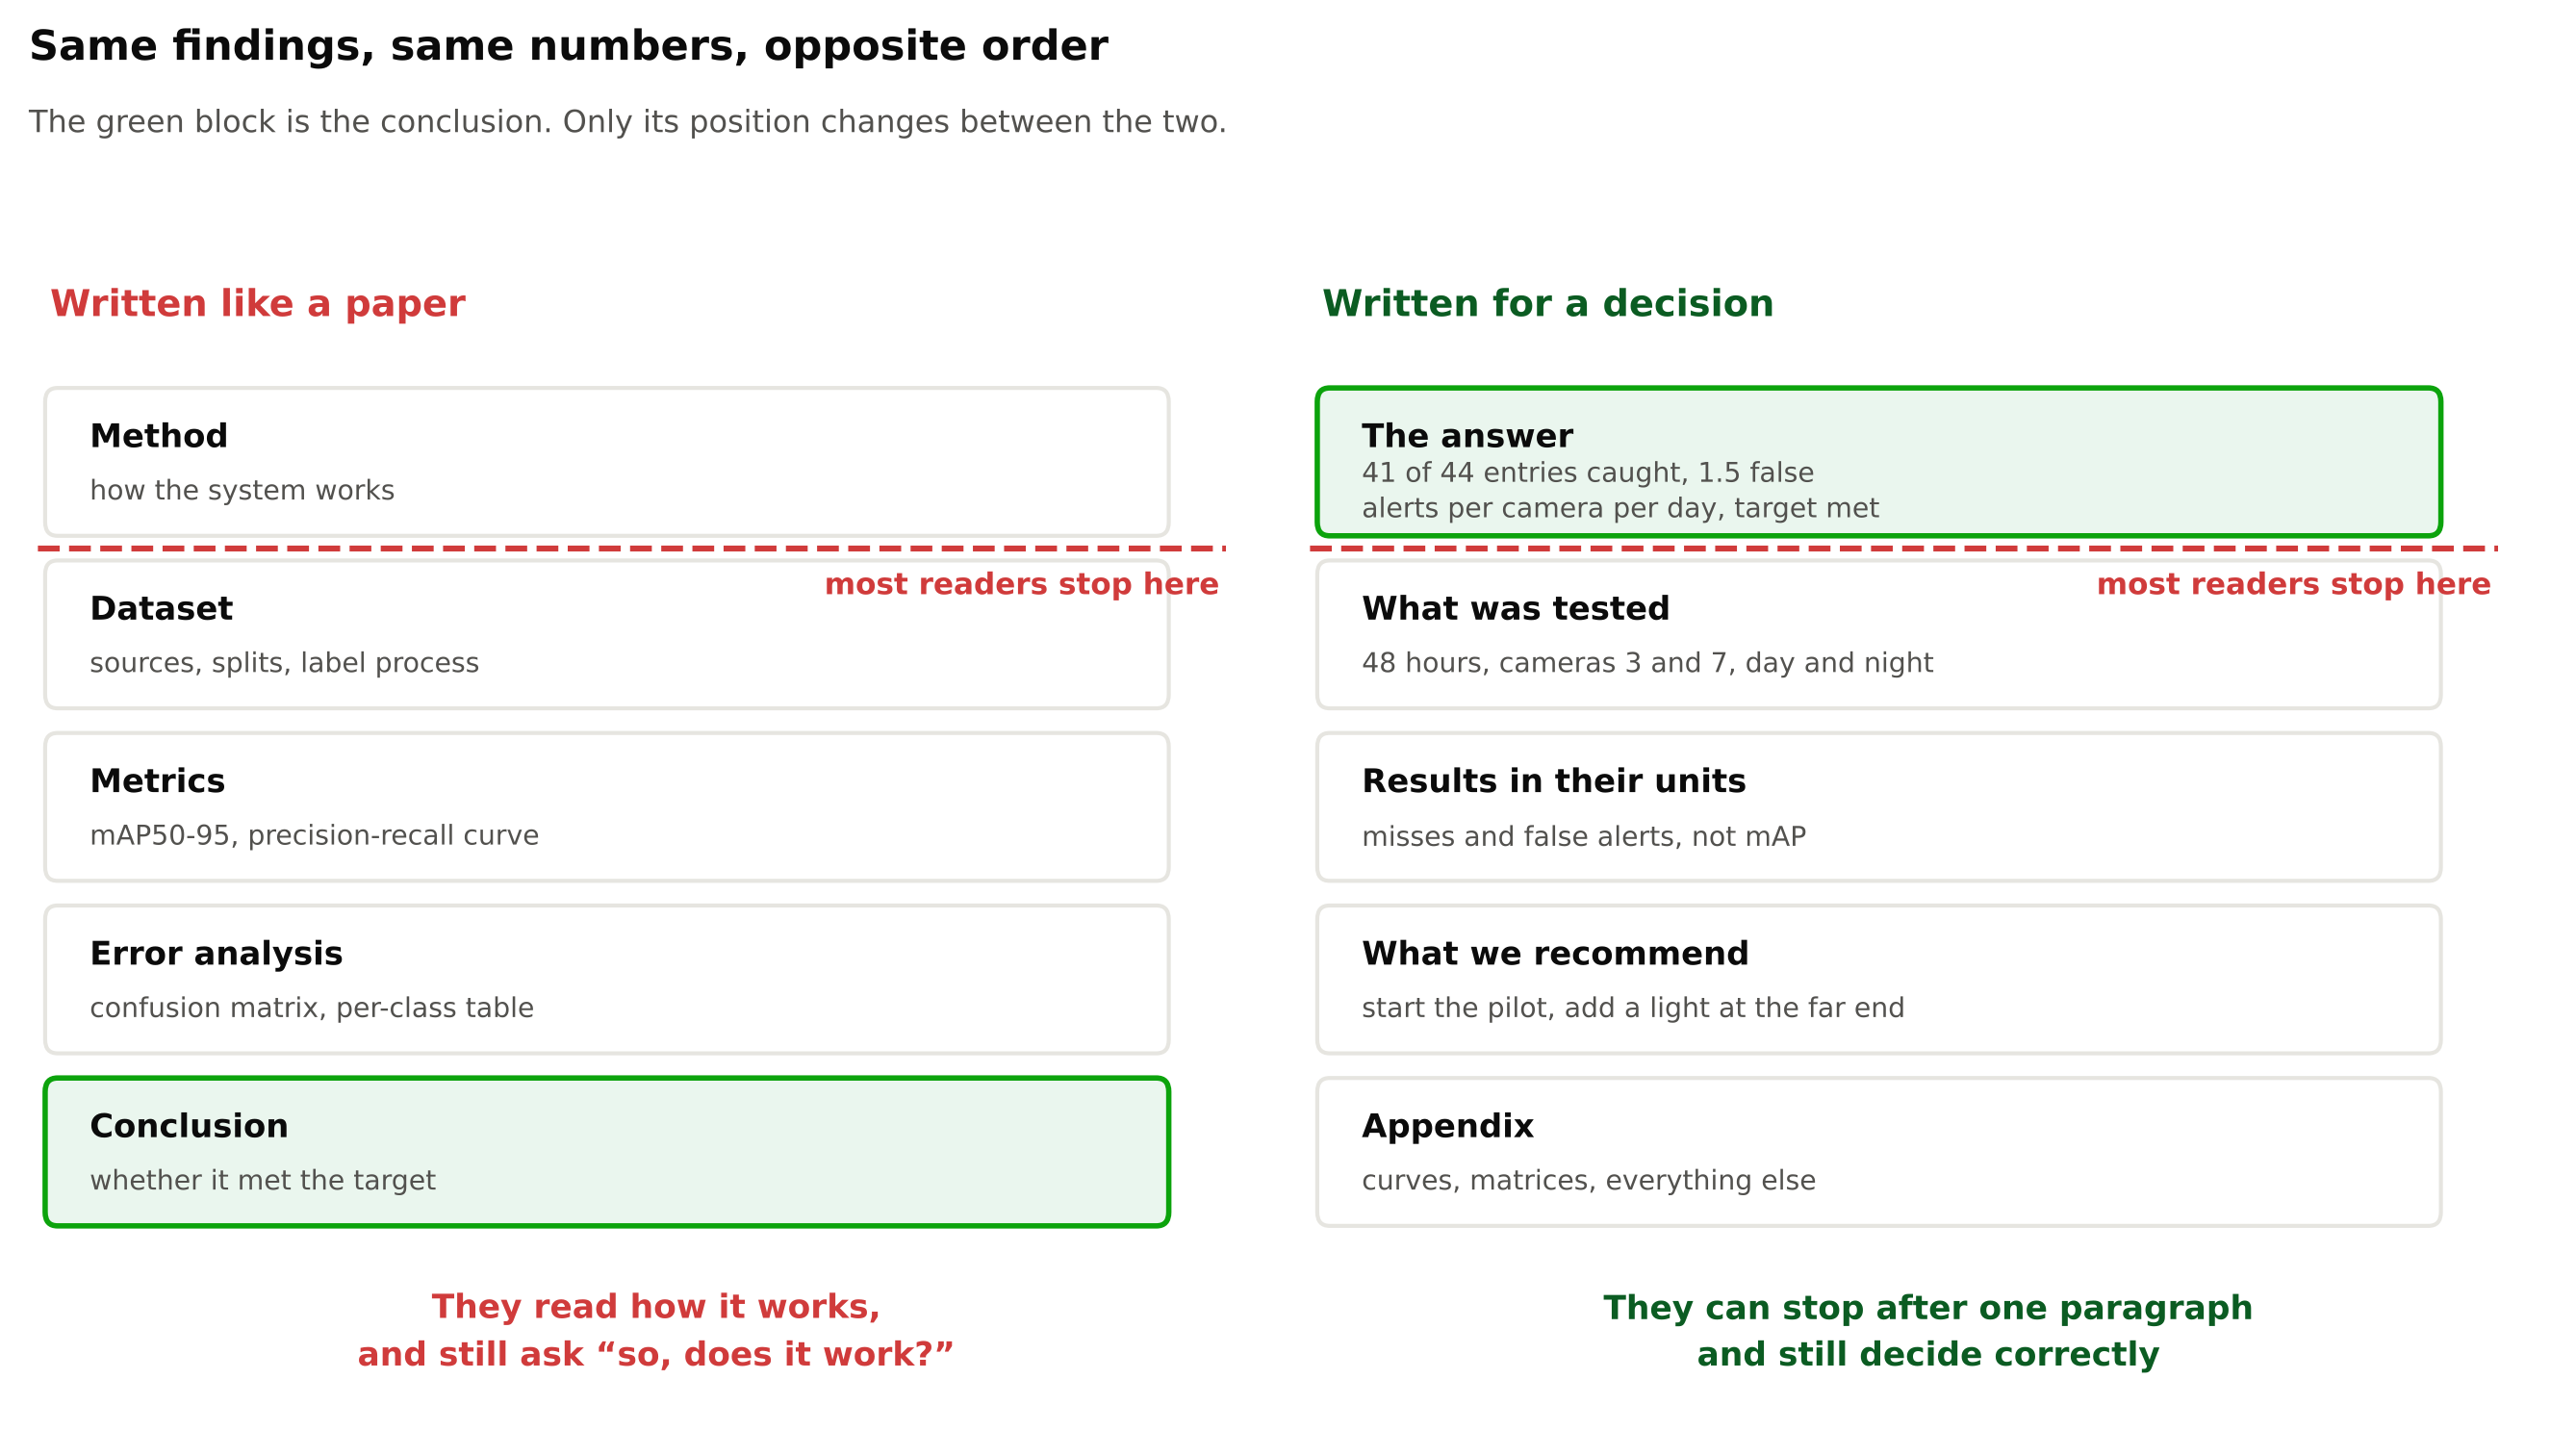
Both columns contain exactly the same work. The difference is that one puts the conclusion where the reader already stopped.
2. What was tested
Short and specific: which cameras, how many hours, which dates, day and night, how events were labelled and by whom. This is what makes the numbers credible. If the test footage was agreed in advance, say so and refer to the agreement. See Agreeing a Measurable Target with a Client.
3. Results in the client's units
Clients think in events, alerts and days, not in boxes and IoU thresholds. Translate:
| Instead of | Write |
|---|---|
| Recall 0.93 | 41 of 44 entries detected |
| Precision 0.87 | About 1 in 8 alerts is false |
| False positive rate per frame | 1.5 false alerts per camera per day |
| Latency p95 1.8 s | Alerts arrive within 2 seconds in 95% of cases |
| mAP50-95 0.61 | (appendix only) |
Event-level numbers are the natural fit; Measuring Video Analytics by Events, Not Frames explains how to compute them. Give counts alongside percentages. "93%" invites the question "of how many?"; "41 of 44" answers it.
4. Pictures of real cases
Show three to six examples: correct detections in typical conditions, the hardest case that worked, each kind of miss, and each kind of false alert. A picture of a missed person 30 metres away in infrared explains the limitation faster than a paragraph. Blur faces where appropriate. See Privacy and Ethics in Camera Analytics.
5. Limits and conditions
State plainly where the system is weaker: night at long range, crowds, rain, a particular camera. Clients forgive limits they were told about. They do not forgive limits they discover after go-live.
6. Recommendations and options
What you suggest doing next, with rough cost and expected effect. Offer real alternatives where they exist: "add a light (one day of electrician time), or accept lower night detection at the far end, or add data from that area (about a week)". Keep estimates honest; Estimating a Computer Vision Project covers ranges.
7. Technical appendix
Everything else: model version, thresholds, dataset versions, full metrics, per-class tables, curves, confusion matrix. Engineers on the client side, auditors and your future self will use it. Nobody else needs to.
Habits that build trust
Be consistent. Use the same numbers in the summary, the body and the appendix. A summary that says 93% and an appendix that says 0.91 (because one is event recall and the other frame recall) makes readers doubt both. If there are two measures, name them differently and explain once.
Show uncertainty without hiding behind it. With 44 events, one more or one fewer miss changes recall by more than two points. Say so in one sentence: "With 44 events, this figure could reasonably vary by several points on different footage." Do not bury the reader in confidence intervals.
Report what went wrong. If an earlier version had problems that were fixed, say so briefly. If the test found a fault in the setup, such as a camera clock that was wrong, include it.
Avoid jargon or define it once. "False alert" is clear. "FP" is not. If you must use a term like "confidence threshold", explain it in one sentence the first time.
Do not oversell. Avoid "the AI understands the scene". Describe what it does: detects people in the zone and sends an alert.
Format
- Keep the main body to two to four pages.
- Use a PDF or a document format the client already uses, with page numbers and a date.
- Put the model and configuration versions on the first page, small, so any number can be traced. See Versioning Datasets and Models Together.
- If you present it in a meeting, use the same structure: answer, evidence, examples, limits, options.
A quick self-test
Before sending, give the first page to someone outside the project and ask them three questions: Does it work? Where does it struggle? What should we do next? If they cannot answer all three from the first page, rewrite the first page.
Checklist
- Know the decision the report supports.
- Open with a one-paragraph answer with key numbers.
- Describe what was tested, briefly and specifically.
- Use events, alerts per day and counts, not model metrics.
- Show pictures of successes, misses and false alerts.
- State limits and conditions plainly.
- Offer options with rough costs.
- Keep technical detail in an appendix.
- Keep numbers consistent across the document.
Next steps: Handover Documentation for a Computer Vision System and Running a Pilot Deployment.